Pepsi Adopts Real-Time Digital Technology Tool for a ‘Quick-Win’
Food and beverage companies are seeking quick wins and ‘proof of technology’ projects that lead to increased efficiencies while also focusing on digital strategy roadmaps so manufacturers can scale.

So many food and beverage manufacturers search for “hidden efficiencies” by unlocking real-time data. G&J Pepsi found crucial KPI data with a real-time tool from Sage Clarity. Image courtesy of PepsiCo
Change is a constant in manufacturing. The “9th Annual State of Smart Manufacturing” report from Rockwell Automation shows that “change management and training employees on updated (technology) processes are the top two workforce-related obstacles” for companies. Besides training existing employees, food and beverage companies are also experiencing increased turnover in end-of-line operations.
To alleviate these problems, food manufacturers are turning to digital technologies and tools with minimal integration for quick wins on key performance indicators (KPIs) and the enterprise picture. Companies are mapping out information data models and strategies that allow for scale. While artificial intelligence (AI) receives much attention, standards or information data models are needed as a foundation and to scale efficiency gains across multiple plants.

The evidence for quick wins is growing with large and small companies. In a recent FOOD ENGINEERING article on data analytical roadblocks, Lisa Zasada, General Mills’ director of reliability and improvement, points to quick wins with digital tools. “I try to avoid the word pilot and move further to proof of technology and of value as very clear terminology because it points to an endpoint by which we're going to make a decision as an organization,” says Zasada.
Quick wins include improving numerous KPIs, such as overall equipment effectiveness (OEE), production volumes, efficiencies, production yield and boosting employee morale. The pressure is on due to post-Covid-19 worker demand, and food manufacturers are moving quickly. The 2024 Smart Manufacturing report says, “the vast majority of manufacturers—83%—say the obstacles faced are accelerating digital transformation.”
“I think people rush to technology too much, and we need to step back and focus on what manufacturing challenge needs to be addressed,” says Rob Schoenthaler, chief revenue officer at ThinkIQ, on the Advanced Manufacturing Now podcast in March. ThinkIQ offers manufacturing traceability services to improve yield, quality, safety, compliance and brand confidence.
The Irvine, CA-based software-as-a-service (SaaS) company identifies production issues or data blind spots and develops iterative—quick-win—approaches for small and big companies. “So when you think about doing things incrementally, there’s two parts that I find valuable with incremental versus big-bang large projects,” says Schoenthaler. “One is reasonable investment, and investment is not just dollars. Time is typically the most precious asset for the manufacturer.”
The other benefit with digital technologies or proof-of-technology demonstrations is problems change from quarter to quarter. “Working in chunks allows course correction to align efforts with business priorities with a reasonable cadence,” says Schoenthaler.
An example of working in chunks even includes large standardization projects, like Barry Callebaut, a global chocolate maker with more than 66 factories. FOOD ENGINEERING documented how the company rolled out its global manufacturing execution systems (MES) and had to start small by identifying common equipment and systems. This rollout started first with a “common vs. unique” approach. The chocolate maker targeted four “common differences” across plants and explained how these attributes make the plants unique: work process-related, equipment and automation-related, workforce-related, and metrics-related.
The hard work paid off. “So we identified about 10% in some cases more of unknown capacity, not unused, but we just didn't know we had that capacity,” says Bram Van Genabet, corporate digital innovation manager at Barry Callebaut. “Ten percent is significant because if you can increase capacity on ten lines by 10%, you get an entire new production line for free.”
Like Barry Callebaut, ThinkIQ’s Schoenthaler believes in moving toward standardization or information models allowing companies to scale connected equipment for richer data insights. “An information model is almost like a template about what is important to collect, understand and analyze for any type of manufacturing process or piece of equipment, etc.,” says Schoenthaler.
The CFO points out that many food manufacturers can gain visibility into blind spots, such as traceability or quality, with an information model approach. ThinkIQ believes that without an information model, it would be almost impossible to find blind spots across supply chains.
“The other thing we see within a company is different constituents, like process engineering, quality or maintenance, each have different needs from data,” says Schoenthaler. “An information model brings a standardized approach to what the data should look like and ensures all constituents benefit and go to one place (for the data).”
The podcast also discussed root cause analysis and the need for more contextual data. Schoenthaler believes in applying graph relationships. “My simple analogy is it's like Facebook for industrial supply chain or manufacturing,” says Schoenthaler. “For example, who is the supplier for the materials, workers, training information and what were the equipment settings are just some of the graph relationships needed in manufacturing.”
“By having information models and a graph relationship capability, we're now able to understand multidimensional relationships between all the physical things that go on in a manufacturing supply chain, back to the old people, materials and equipment,” says Schoenthaler.
Blind Spots and Improving Uptime at Pepsi
Recently, G&J Pepsi adopted Sage Clarity's automated data acquisition tool, ABLE, and its One View accelerator app suite to increase uptime for its four manufacturing facilities. G&J Pepsi bottles and distributes more than 30 beverage brands while overseeing 700 stock-keeping units (SKUs) at four facilities. The problem facing G&J Pepsi was a need for accurate data visibility into production stoppages due to manual data collection via operators for OEE.
With this type of volume, G&J Pepsi wanted automated and real-time reporting of production stoppages but needed a technology solution to meet the immediate need. Before implementation, G&J Pepsi documented five stops/week on a line. However, after implementing the real-time data platform, the actual numbers proved to be more than 75 stops a day, or about 375 stops a week.
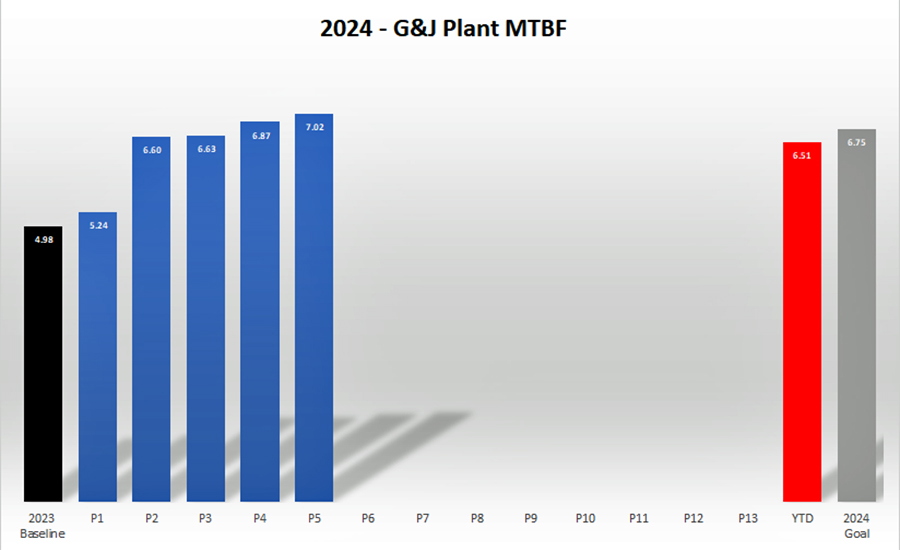
“The real ‘ah-ha’ moment was when we could see the MTBF number and lines stopping every three minutes, and the best line was stopping every 16.5 minutes,” says Jeff Erwin, VP of manufacturing and quality at G&J Pepsi. “With the real-time insights into performance, we’ve been able to increase MTBF to 30, 40, and in some instances 50 minutes MTBF, so we know the true value the data acquisition solution brings.”
“The reality in the food and beverage sector is 40% of downtime is related to minor stops,” says John Oskin, president at Sage Clarity. “From our benchmarks, we know an average production line stops 20,000 times a year, and there is no way to capture that information manually.”
The key to this solution is the simplicity of Sage Clarity’s ABLE (Automation Business Engine Logic), which allows food and beverage manufacturers to leverage data from machine and line programmable logic controllers (PLCs). For end users, no additional PLC programming is needed for data acquisition from its logic engine. At G&J Pepsi, the company collects data on all unit operations, not just production lines: de-palletizers, fillers, cartoners, labelers, case packers.
Depending on the application and customer needs, ABLE identifies critical data, benchmarks it against nominal parameters, and provides real-time root cause analysis. "Our technology includes intelligent root cause analysis that allows the system to determine which piece of equipment caused the line to go down," says Oskin.
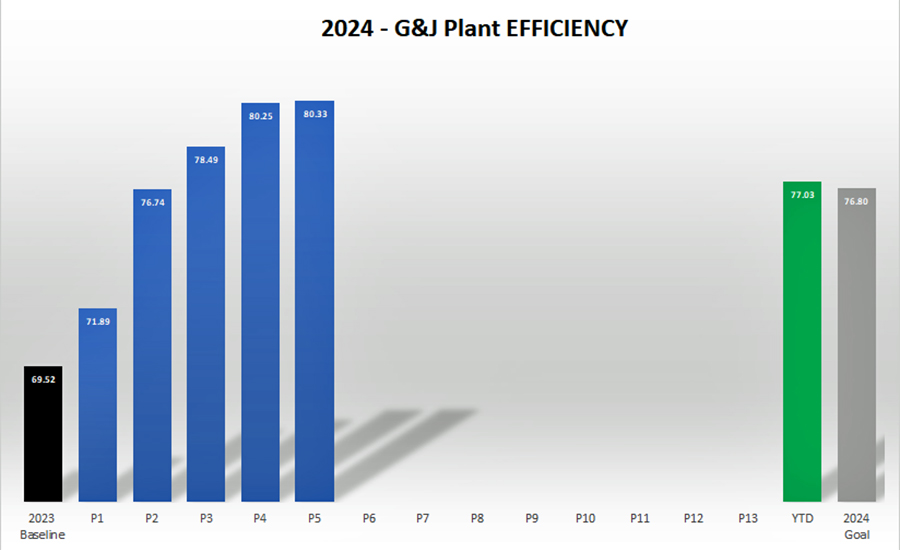
The new data platform at G&J Pepsi collects data and produces numerous KPIs. These KPIs include material costs, labor, true OEE and accurate efficiency numbers. The “quick-win” data tool monitors over 100 assets at Pepsi. “My prior experience and need to have advanced data collection from the PLCs, extensive reporting and needing to achieve results quickly was how I learned about ABLE and the One View accelerator app suite,” says Erwin.
The data visualization solution at G&J also delivers MTBF and MTTR calculations with detailed visualization, including plant floor KPI heatmaps of the “hot spots'' in the plant exhibiting poor performance. G&J Pepsi reports MTBF has gone from 4.98 min. to 7.02 min., and rate loss improvement decreased to 7.13% from 12.42% on its can lines.
At the plant, operators view the KPIs via overhead monitors and rely on Epicor’s scoreboard analytics. "This tool is our first line of defense against production stops, providing fault information at the PLC level and pushing it over to Epicor's EMI system," says Erwin.
The data acquisition platform exists between the plant floor and manufacturing execution system (MES) for G&J Pepsi, and the app suite One View combines data from Epicor’s EMI platform. One-View's "shallow dive" analytics deliver a dashboard view for executives via a smartphone, iPad or computer.
"By automatically tagging downtime, we are taking analytics to a new level while One View gives an executive summary for someone who doesn't need to dive into the details but still wants to see performance,” says Erwin.
For the actual implementation and data acquisition, G&J Pepsi added equipment to its operations technology (OT) network, which helped accelerate integration. The first plant was finished in six weeks, while the following three plants took four weeks to integrate the technology solution.
Improved OEE at G&J Pepsi
With the move away from manual data collecting, G&J Pepsi operators are now focusing on continuous improvements and documenting improved OEE and uptime. G&J Pepsi’s real-time data platform has changed operators’ daily work to more “on-the-floor” troubleshooting and validating that their auto-tagging is accurate.
Below are some of the results:
- 15% Improvement in production within six months
- 70% reduction in engineering time
- Real-time visibility of stops
- 5x improvement in data fidelity
Besides production improvements, G&J Pepsi also reports a 15% reduction in safety reporting, and employee retention is getting stronger: screening, background checks, hiring, onboarding and training expenses are declining. Going forward, G&J Pepsi will connect secondary operations and equipment to the real-time data acquisition tool, such as its blow-mold bottle and corrugate display manufacturing.
Looking for a reprint of this article?
From high-res PDFs to custom plaques, order your copy today!